Exploring the Wide World of ggplot2 Extensions
Packages that extend ggplot2
Some packages add new layers or themes that can be combined with standard ggplot2 functions.
Packages that wrap ggplot2
Other packages provide convenience “all-in-one” functions that combine multiple layers for you.
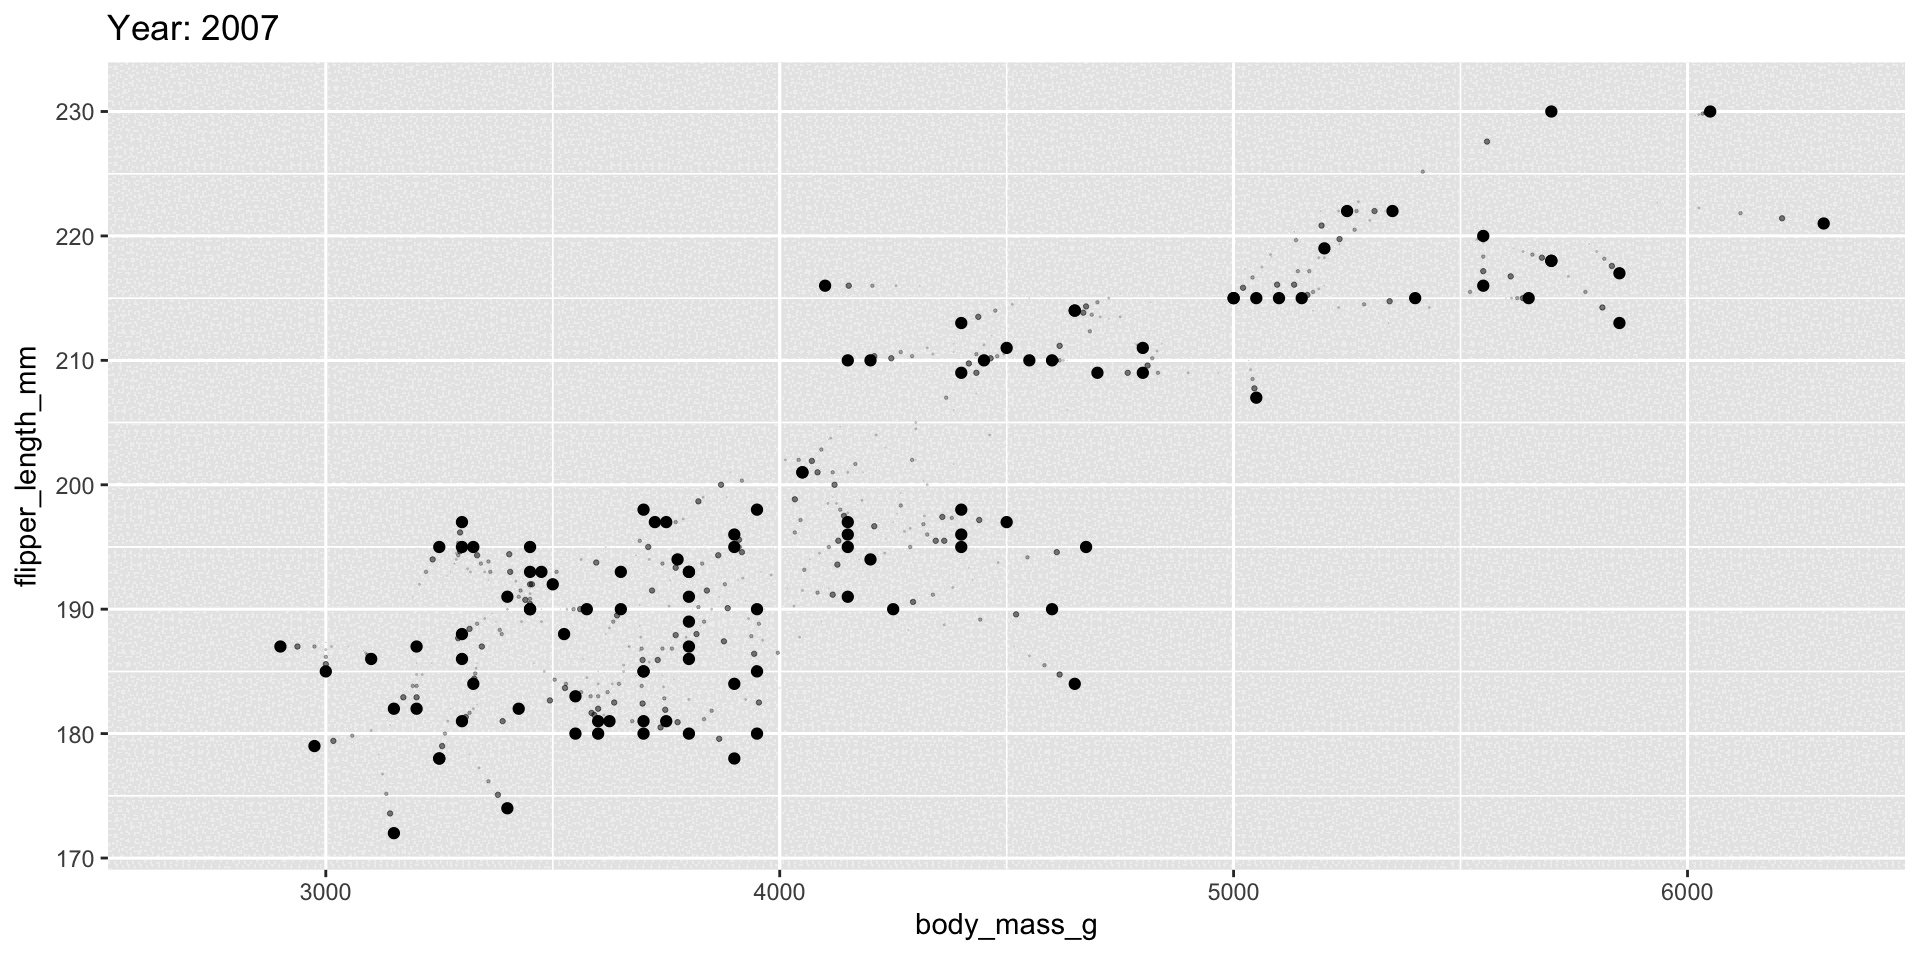
gganimate

gganimate
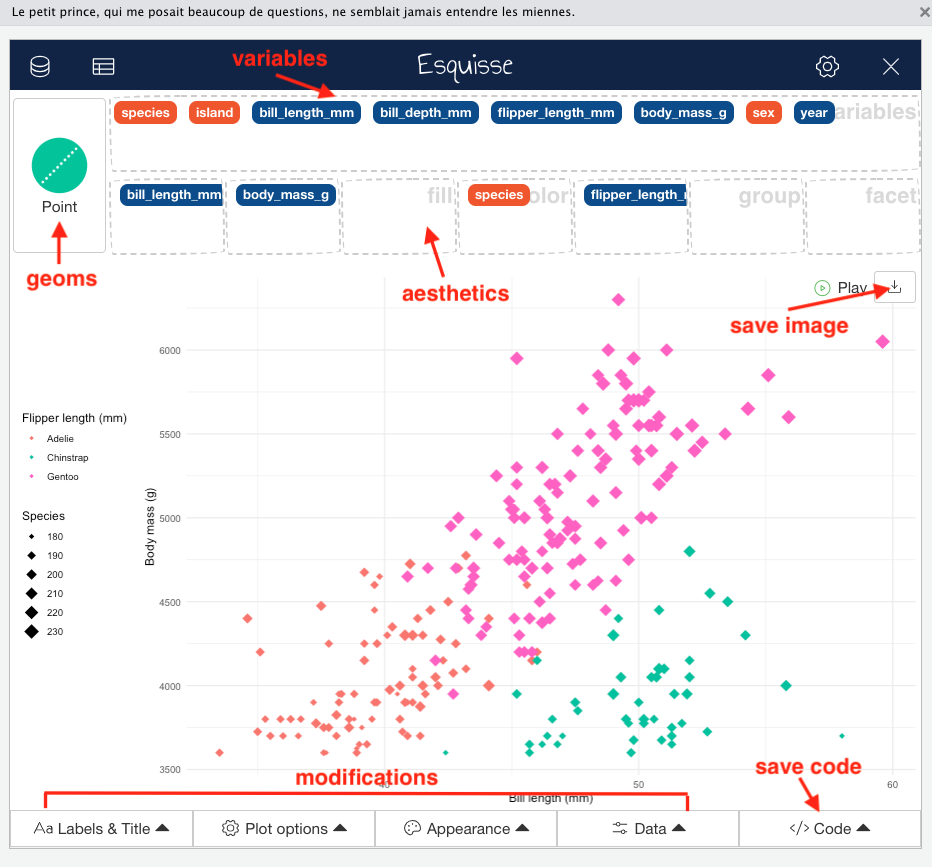
esquisse
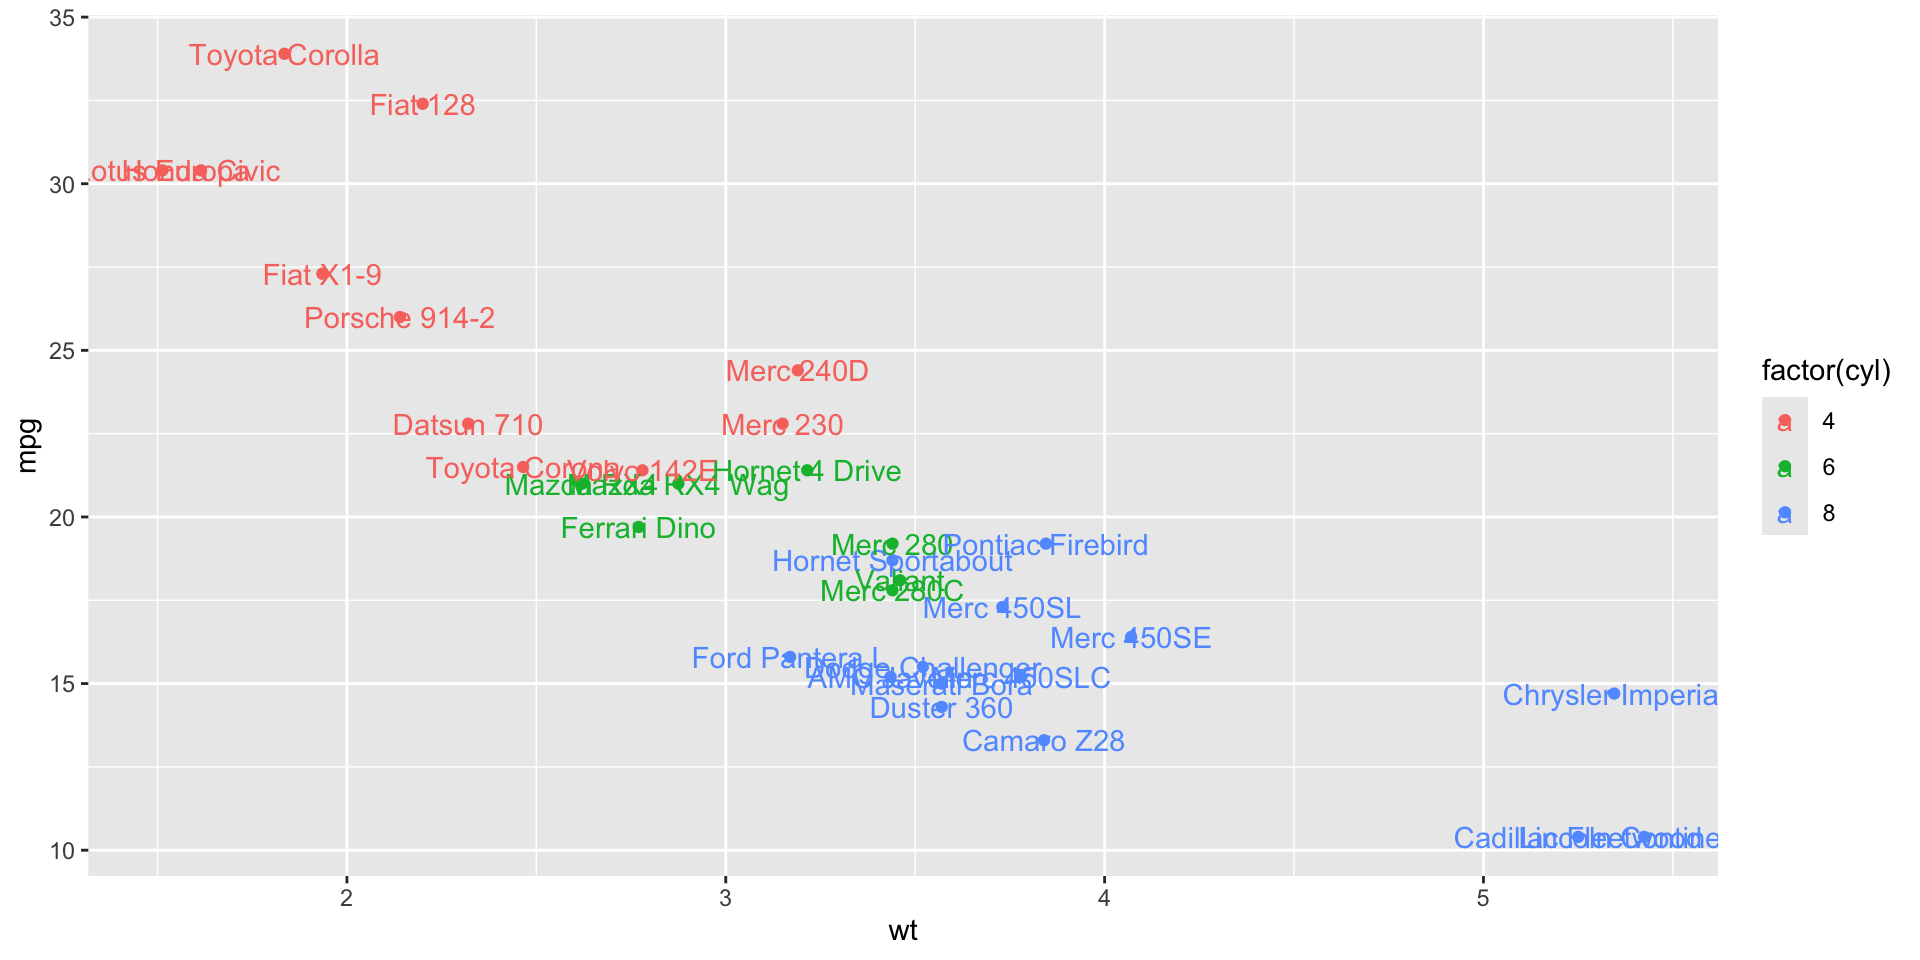
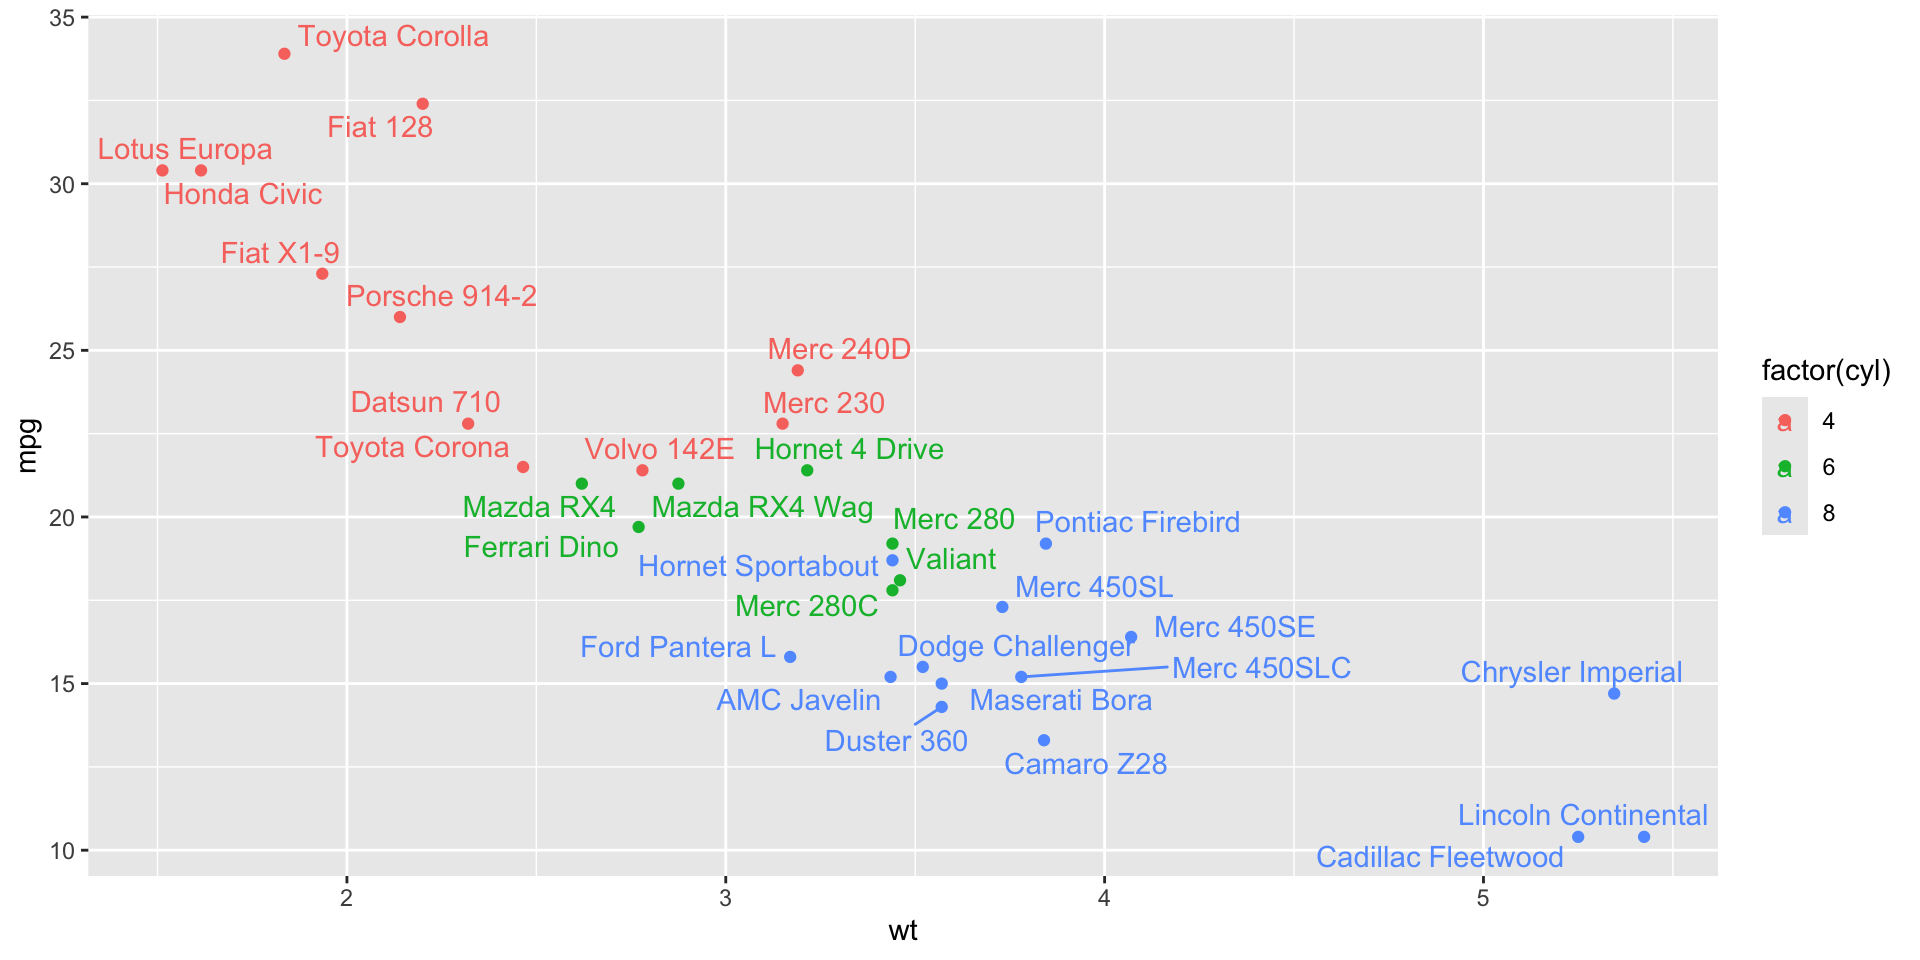
ggrepel
The ggrepel package is helpful for directly labeling plots, especially when labels would otherwise overlap.